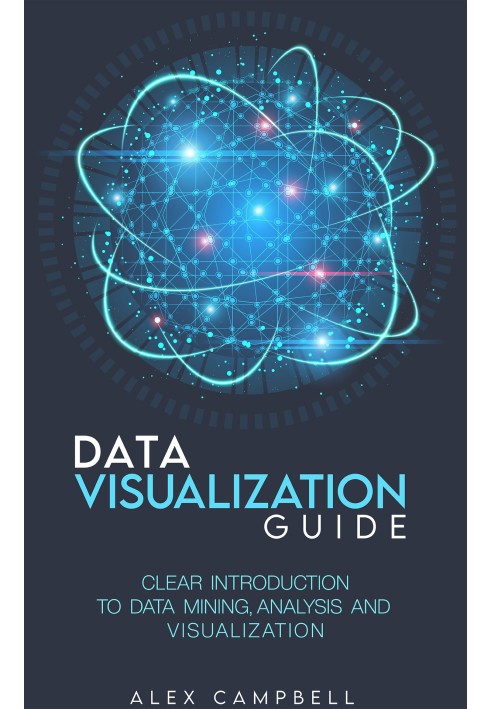
Book Data Visualization Guide
"Guide to data visualization" is a book that opens up to the reader wide possibilities of interpretation and display of information with the help of graphs, charts, maps and other visual means. The authors cover in detail the basic principles of data visualization, helping readers better understand how to effectively use this tool to present complex information in an accessible form. In addition to the theoretical aspects, the book contains practical advice and guidance on choosing the most effective visualization methods for specific types of data. A Guide to Data Visualization will be an excellent addition to the library of anyone interested in analytics and data visualization.
- Name of the Author
- Alex Campbell
- Number of pages
- 471
- Language
- English
- Cover
- Soft
Reviews
More books on this topic
Book JavaScript in examples and tasks
224 UAH
202 UAH
Book Unreal Engine VR for developers
140 UAH
126 UAH
Book Easy method to learn Python 3...
124 UAH
112 UAH
Book How to become a programmer from...
117 UAH
106 UAH
Book We study programming on the...
224 UAH
202 UAH
Book The entertaining programming is...
49 UAH
45 UAH
Book Programming of Si language. Bases
49 UAH
45 UAH
Book Arduino: Beginning of way
147 UAH
133 UAH
Book Unreal Engine 4 for a design and...
120 UAH
108 UAH
Book We program with children. Create...
135 UAH
122 UAH


11/04/2022
Незамінний ресурс для всіх, хто працює з даними!
"Путівник з візуалізації даних" - це справжній скарб для тих, хто прагне покращити свої навички в аналітиці та візуалізації інформації. Книга детально розглядає основні принципи візуалізації, що робить її зрозумілою навіть для початківців. Автори не лише надають теоретичні знання, але й пропонують практичні поради, що дозволяє читачам застосовувати отримані знання на практиці. Я особисто знайшов багато корисних інструментів та методів, які допомогли мені представити складні дані у зрозумілій та привабливій формі. Ця книга стала для мене настільною, і я рекомендую її всім, хто хоче навчитися ефективно візуалізувати дані та робити їх більш доступними для аудиторії. Вона обов'язково займе своє місце у бібліотеці кожного аналітика!